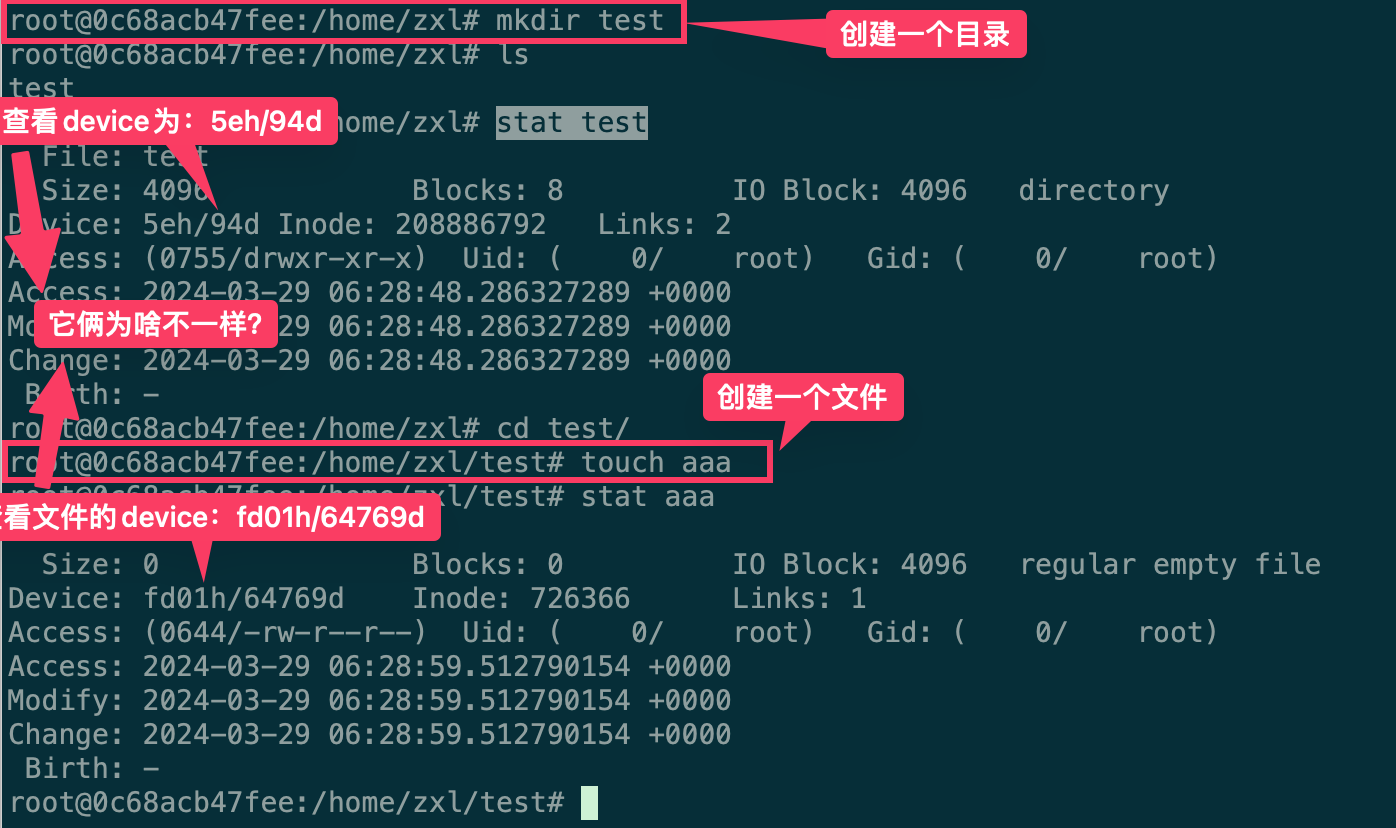
背景 群友发现了一个问题,为什么在容器里面创建的文件夹与文件的deviceId不相同。正常情况下应该是相同的,但是在他的环境中是不同的,具体情况如下图所示:
这个问题群里没有人复现,但是后来群友补充到在centos 7.4 中可以稳定复现。其他系统版本不会出现。到这里我基本上猜测是overlayfs本身的变动,或者说是其他版本的系统中已经默认使用overlay2作为默认的docker driver替换了overlayfs了。
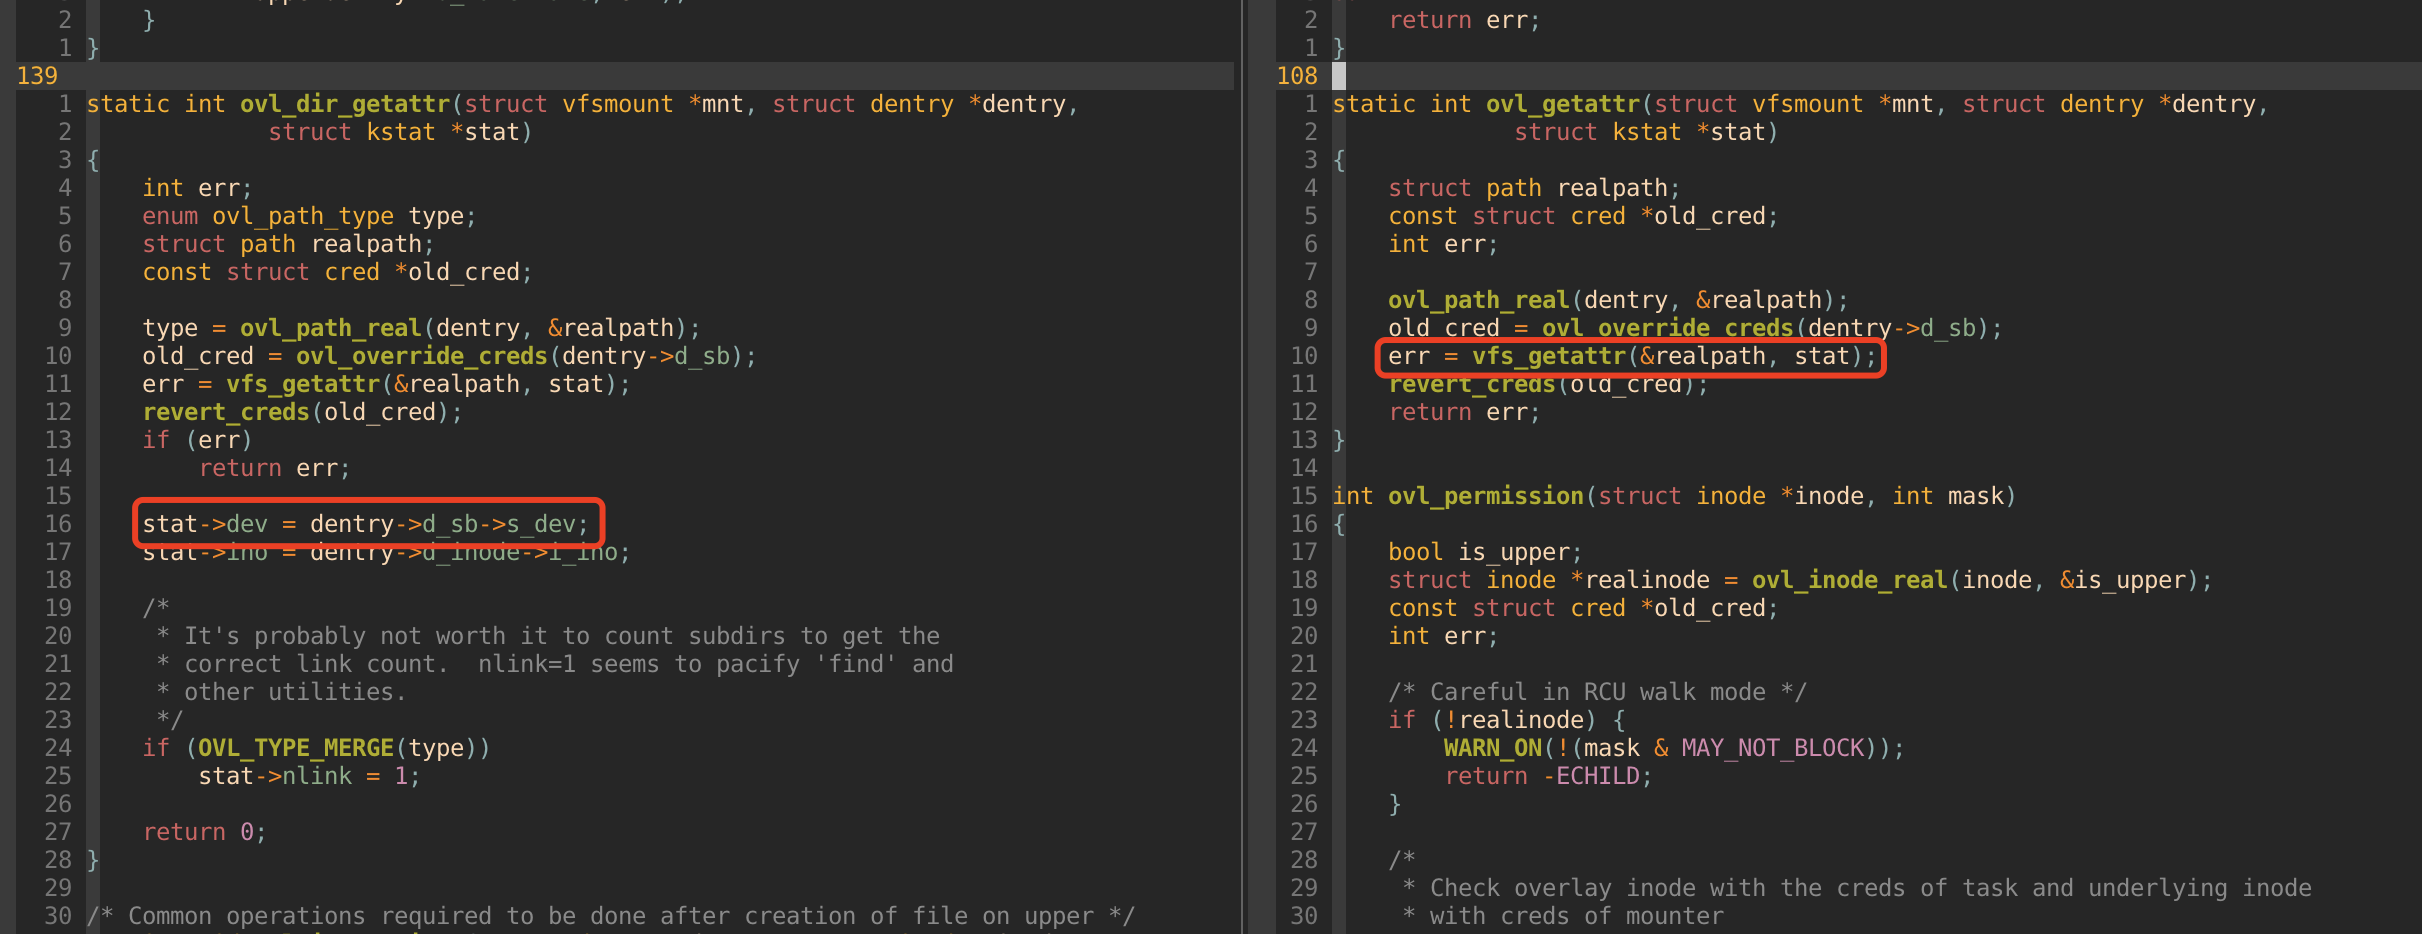
到了凌晨的时候,在群里的一个同事。把相关代码定位到了。具体的是内核中overlayfs的实现导致的,目录与文件获取deviceId的行为不一致。具体情况如下图所示:
对于个人来说相对一个理想的方式是通过一些工具能够定位到具体调用了哪些函数,最好还能观测到函数的返回值。然后定位到这个东西(dev 信息)是哪个函数拿到/生成并返回的。然后去阅读相关代码。
如果这个流程能够完善,那相对来说对个人的能力的依赖会非常的低。无非就是不断的观测函数返回值,然后做二分查找。逐步缩小定位到相关的函数。几乎就是只要知道工具,有基本的代码阅读能力就能够排查很多问题。甚至基本的阅读能力也可以让GPT去提供。
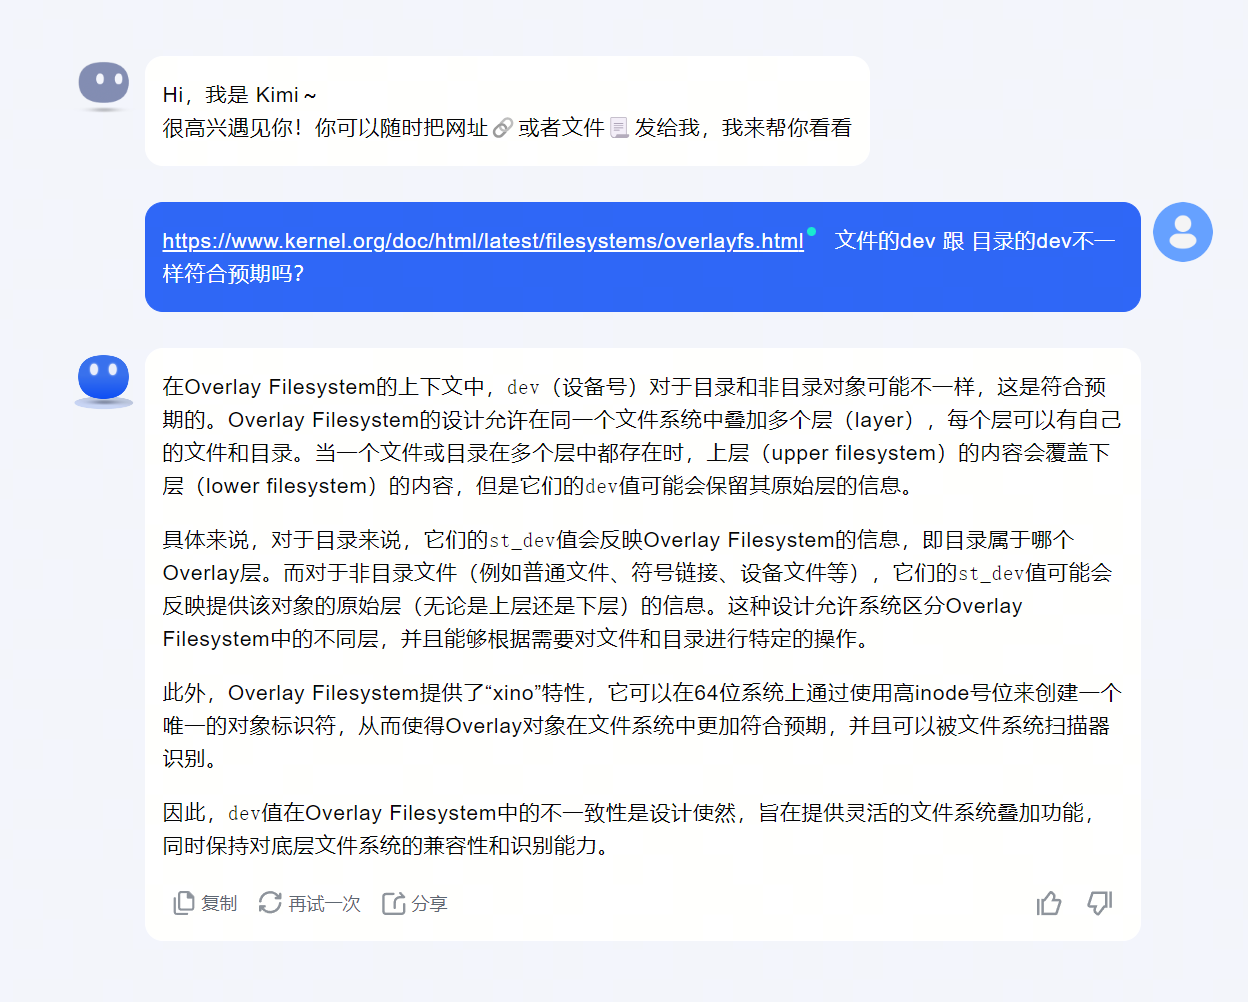
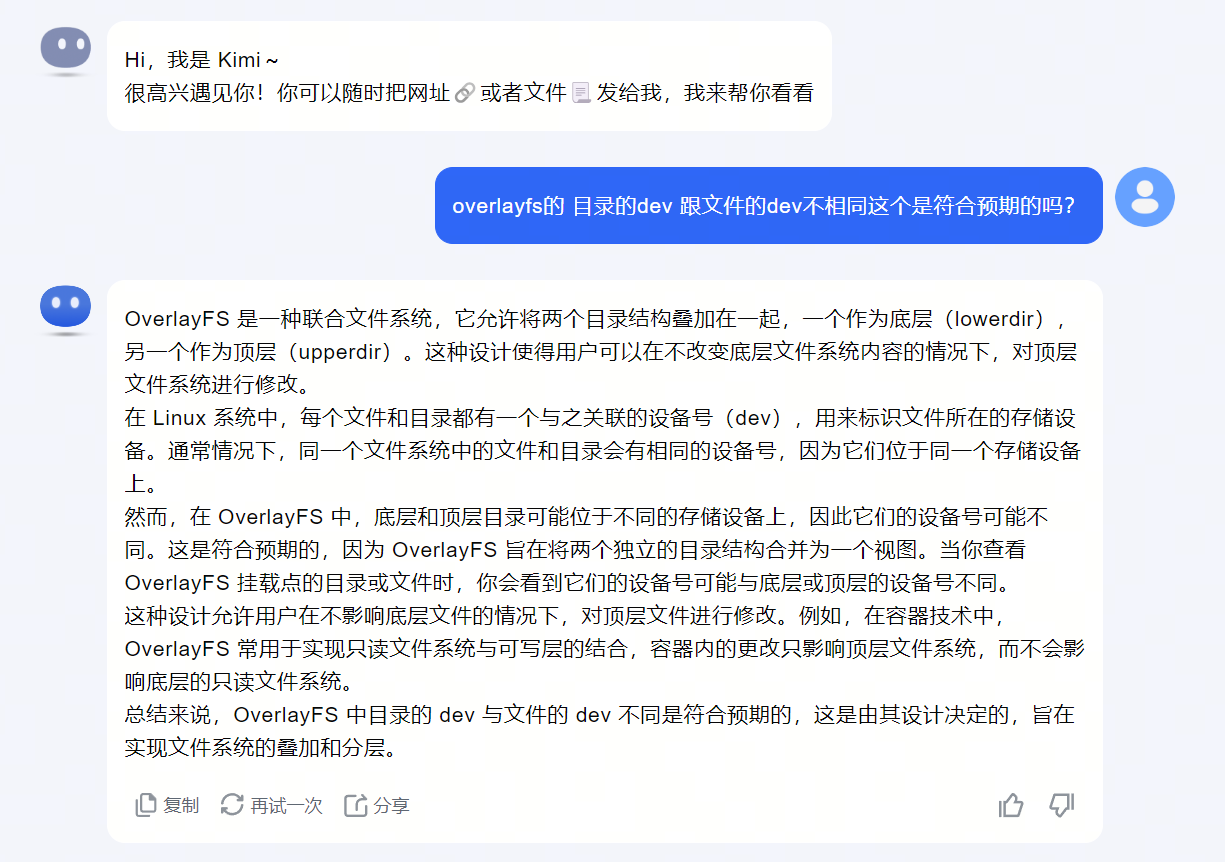
试试Kimi
这道题秒了,不用查了~
note
但实际上如果我们知道文档中有相关描述的情况下大概率已经知道答案了。
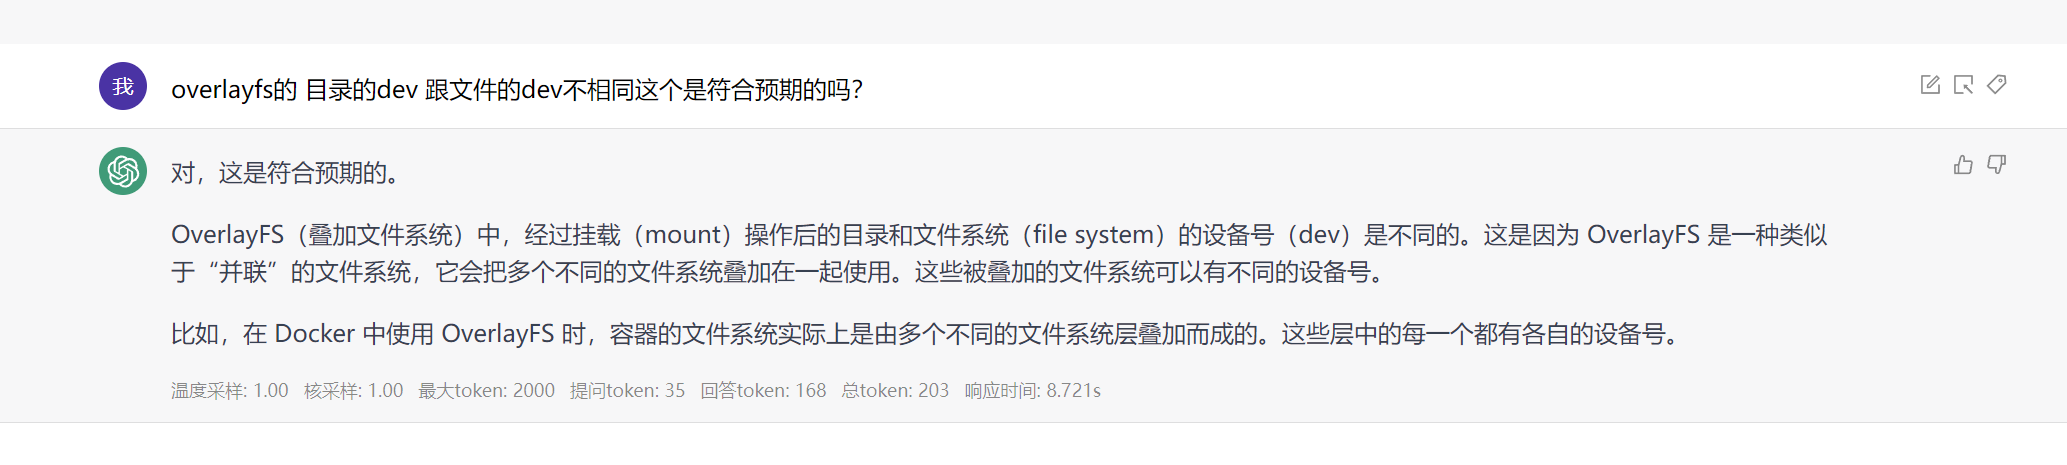
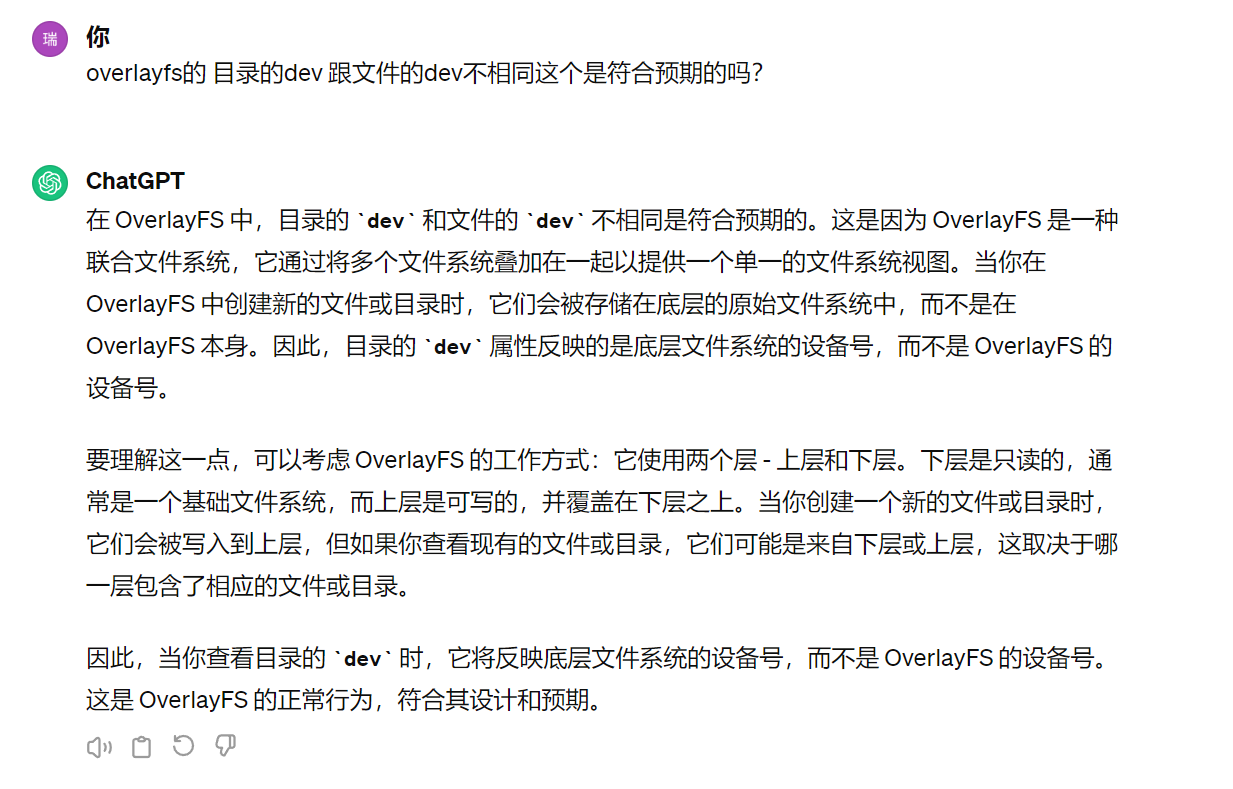
在不提供具体文档的情况下回答的似乎都不太对具体如下:
note
现实还是有不少问题我们现在还没办法通过AI直接拿到答案。可能需要一点点的努力。现在我们继续排查。
理想的排查流程 note
本文不严格区分glibc中的系统调用,与内核的系统调用。
复现 找一台centos 7.4 的机器,virtualbox起一个
1
2
3
4
5
6
7
8
9
10
11
12
13
14
15
16
17
cd /rootmkdir lo up work merged// 更多使用方式参考 https://flyflypeng.tech/%E4%BA%91%E5%8E%9F%E7%94%9F/2023/03/29/Overlay-%E6%96%87%E4%BB%B6%E7%B3%BB%E7%BB%9F.html mount -t overlay overlay -o lowerdir=./lo,upperdir=./up,workdir=./work ./merged mkdir merged/testtouch merged/test/1stat merged/test File: ‘merged/test’ Size: 15 Blocks: 0 IO Block: 4096 directory Device: 27h/39d Inode: 16993 Links: 2 stat merged/test/1 File: ‘merged/test/1’ Size: 0 Blocks: 0 IO Block: 4096 regular empty file Device: 801h/2049d Inode: 4207289 Links: 1
我们观测到成功复现目录跟文件的device不相同。
排查 1 2 3 4 5 6 strace -P merged/test/1 stat merged/test/1 strace: Requested path 'merged/test/1' resolved into '/root/merged/test/1' lstat("merged/test/1" , {st_mode=S_IFREG|0644, st_size=0, ...}) = 0 File: ‘merged/test/1’ Size: 0 Blocks: 0 IO Block: 4096 regular empty file Device: 801h/2049d Inode: 4207289 Links: 1
我们可以观察到有一个lstat的系统调用。
我们采用分析工具,终端一启动分析工具
1 2 3 git clone https://github.com/brendangregg/perf-tools cd kernel./funccount "*lstat*"
终端二执行具体的命令
1 2 3 4 5 stat merged/test/1 File: ‘merged/test/1’ Size: 0 Blocks: 0 IO Block: 4096 regular empty file Device: 801h/2049d Inode: 4207289 Links: 1
我们观测到终端二执行后终端一有如下实处
1 2 3 4 5 6 7 ./funccount "*lstat*" Tracing "*lstat*" ... Ctrl-C to end. ^C FUNC COUNT SyS_newlstat 1
我们发现有一个相关的系统调用 SyS_newlstat 我们进一步跟踪一下
终端一执行
1 2 ./funcgraph SyS_newlstat Tracing "SyS_newlstat" ... Ctrl-C to end.
终端二分别执行
1 2 stat merged/teststat merged/test/1
观察到终端一输出
1 2 3 4 5 6 7 8 9 10 11 12 13 14 15 16 17 18 19 20 21 22 23 24 25 26 27 28 29 ------------------------------------------ 0) stat-1348 => stat-1349 ------------------------------------------ 0) | SyS_newlstat 0) | vfs_fstatat .. 省略若干 0) | vfs_getattr 0) | security_inode_getattr 0) | selinux_inode_getattr 0) | __inode_security_revalidate 0) 0.340 us | _cond_resched(); 0) 2.670 us | } 0) | inode_has_perm.isra.33.constprop.64 0) 1.430 us | avc_has_perm_flags(); 0) 3.910 us | } 0) + 11.550 us | } 0) + 13.980 us | } ------------------------------------观察这部分---------------------------------- 0) | ovl_dir_getattr [overlay]() { 0) | ovl_path_real [overlay]() { 0) 1.340 us | ovl_path_type [overlay](); 0) 4.480 us | } 0) | ovl_override_creds [overlay]() { 0) 0.320 us | override_creds(); 0) 2.610 us | } ------------------------------------观察这部分---------------------------------- ... 省略若干 0) ! 290.269 us | }
1 2 3 4 5 6 7 8 9 10 11 12 13 14 15 16 17 18 19 20 21 22 23 24 25 26 27 28 29 30 31 32 33 34 35 36 37 38 39 40 41 ------------------------------------------ 0) stat-1349 => stat-1350 ------------------------------------------ 0) | SyS_newlstat 0) | vfs_fstatat 0) | user_path_at 0) | user_path_at_empty 0) | getname_flags 0) | kmem_cache_alloc 0) 1.530 us | _cond_resched(); 0) 8.100 us | } 0) + 11.010 us | } ... 省略若干 0) | vfs_getattr ------------------------------------观察这部分---------------------------------- 0) | ovl_getattr [overlay]() { 0) | ovl_path_real [overlay]() { 0) 1.290 us | ovl_path_type [overlay](); 0) 4.870 us | } 0) | ovl_override_creds [overlay]() { 0) 0.320 us | override_creds(); 0) 2.570 us | } 0) | vfs_getattr 0) | security_inode_getattr 0) | selinux_inode_getattr 0) | __inode_security_revalidate 0) 0.300 us | _cond_resched(); 0) 2.520 us | } 0) | inode_has_perm.isra.33.constprop.64 0) 0.440 us | avc_has_perm_flags(); 0) 2.680 us | } 0) 9.180 us | } 0) + 11.410 us | } 0) 1.950 us | xfs_vn_getattr [xfs](); 0) + 18.310 us | } ------------------------------------观察这部分---------------------------------- 0) 0.310 us | revert_creds(); 0) + 35.830 us | } 0) + 54.870 us | } 0) ! 291.789 us | }
我们观测到如下现象
目录的话使用的是ovl_dir_getattr 这个函数处理
文件的话使用的是 ovl_getattr 这个函数处理
我们进一步翻阅代码。
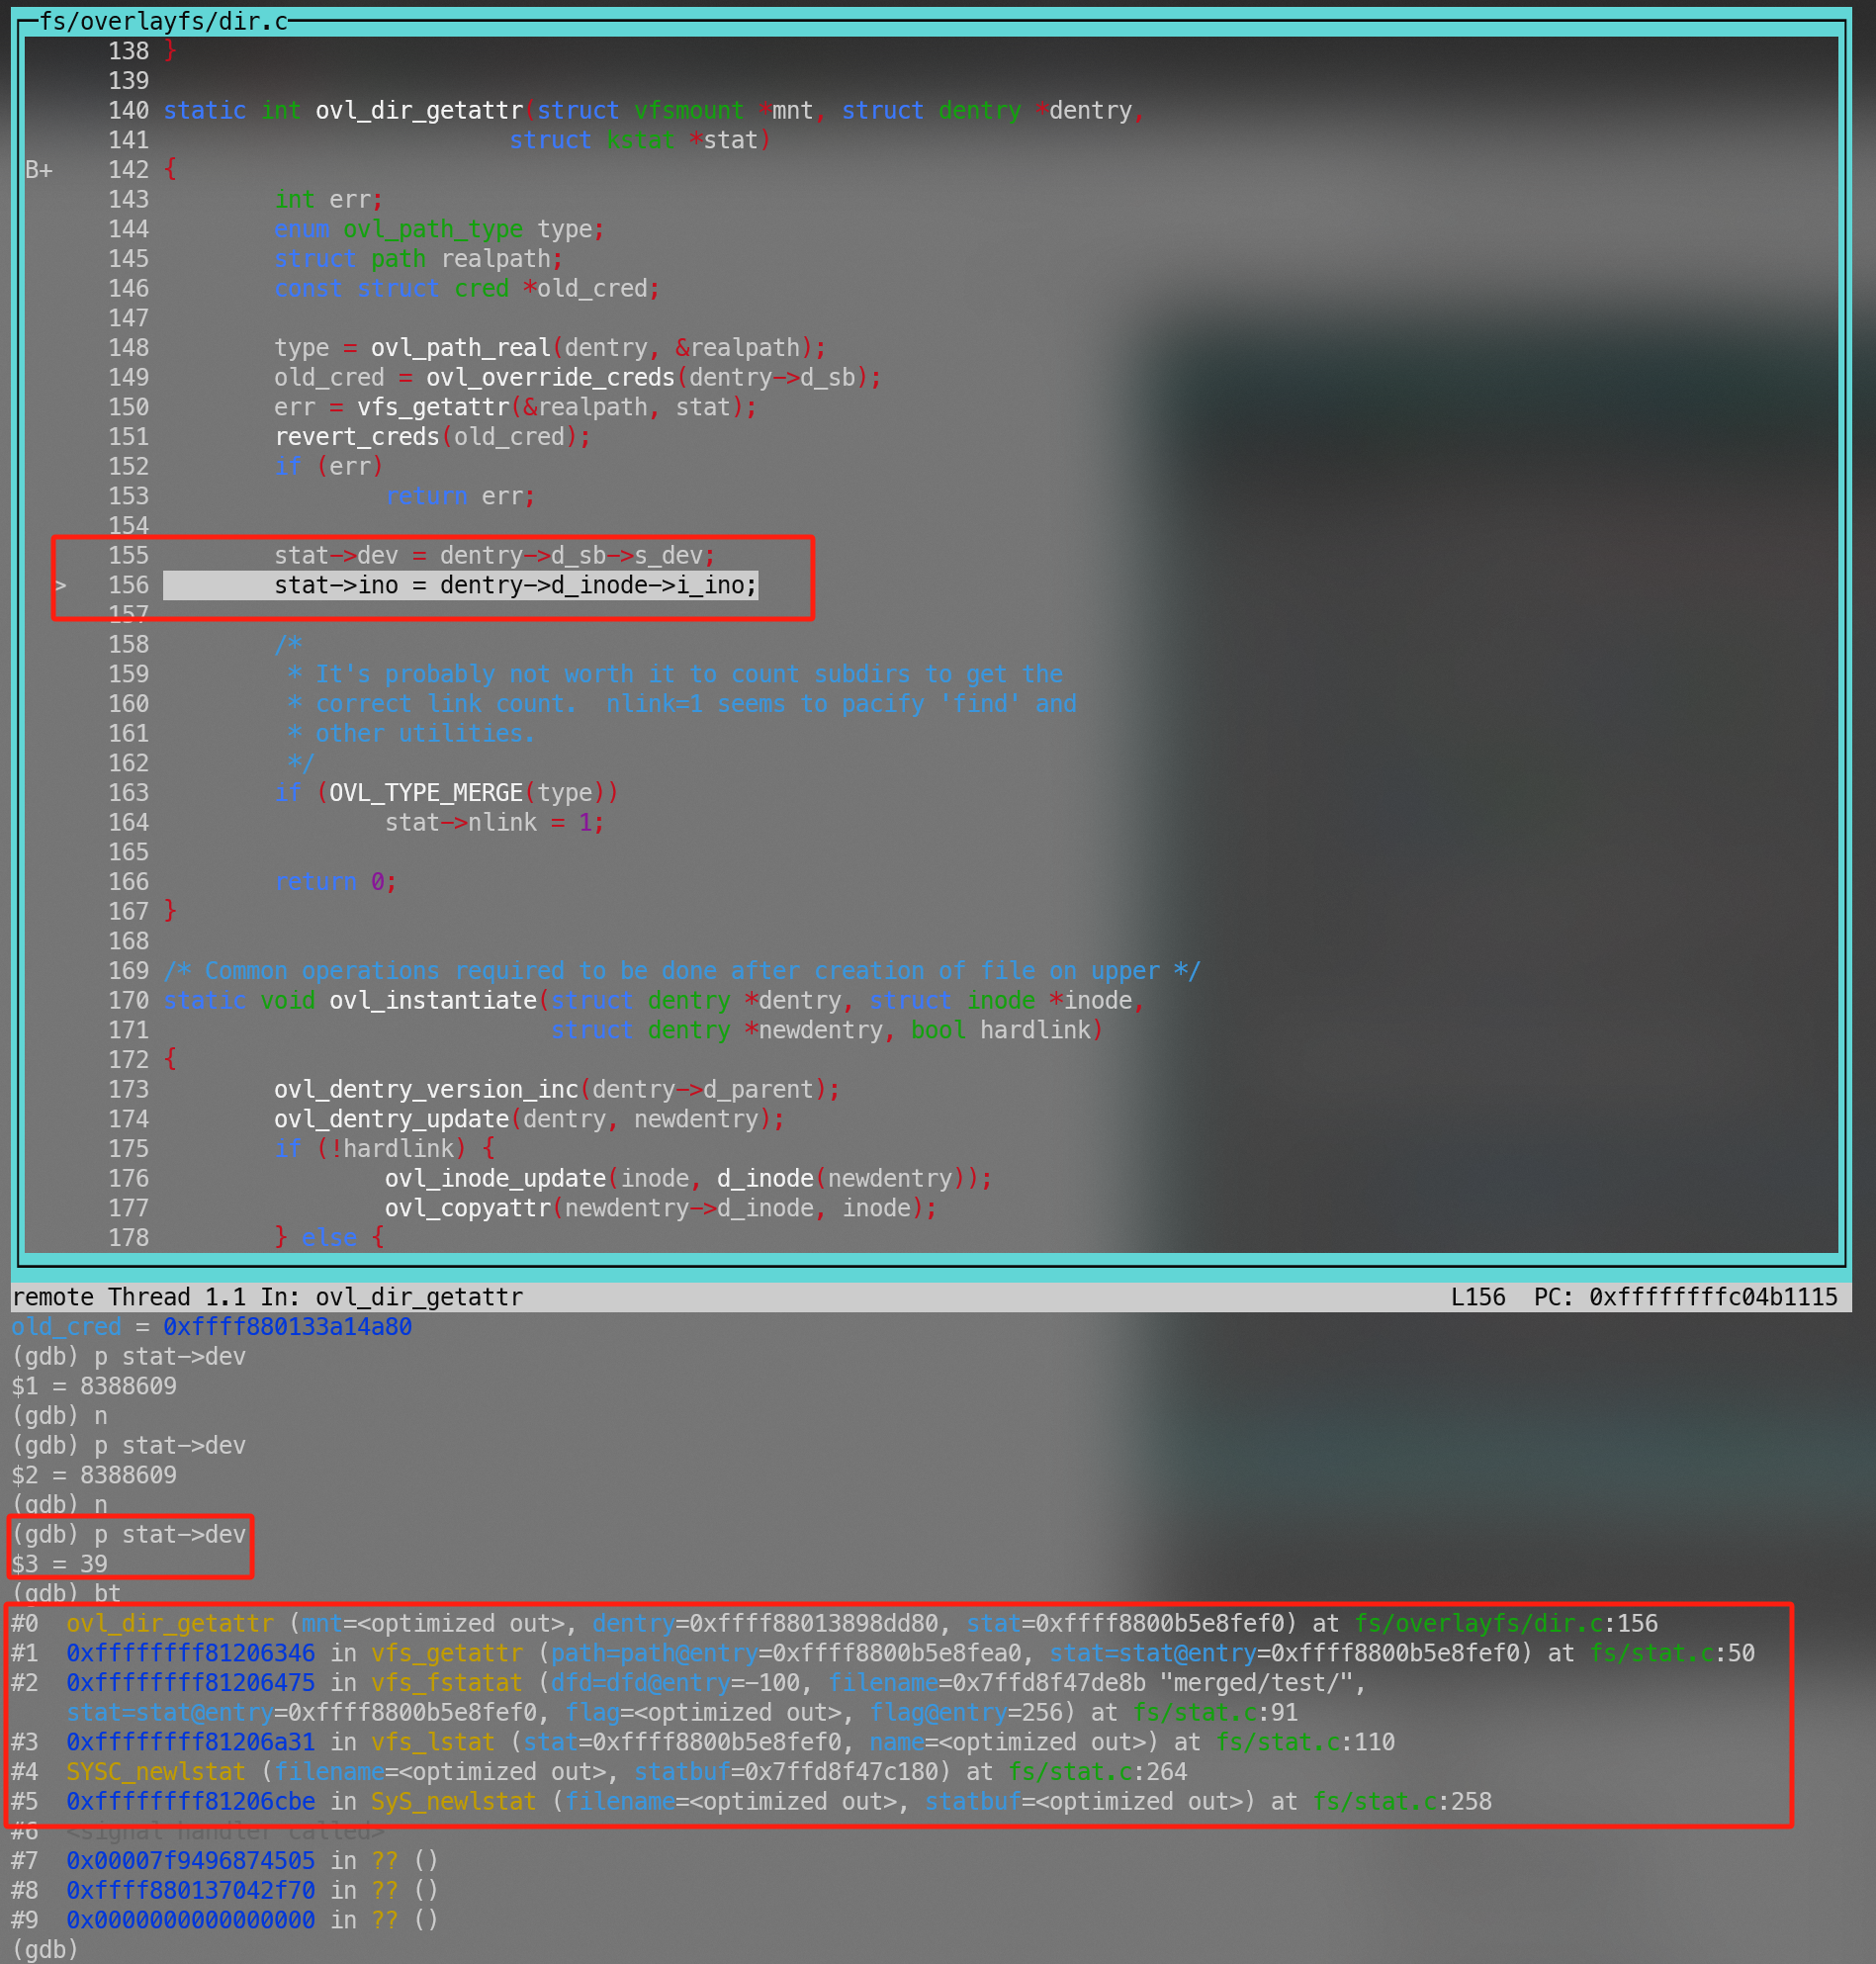
目录 1 2 3 4 5 6 7 8 9 10 11 12 13 14 15 16 17 18 19 20 21 22 23 24 25 26 27 28 29 static int ovl_dir_getattr (struct vfsmount *mnt, struct dentry *dentry, struct kstat *stat) { int err; enum ovl_path_type type ; struct path realpath ; const struct cred *old_cred ; type = ovl_path_real(dentry, &realpath); old_cred = ovl_override_creds(dentry->d_sb);、 err = vfs_getattr(&realpath, stat); revert_creds(old_cred); if (err) return err; stat->dev = dentry->d_sb->s_dev; stat->ino = dentry->d_inode->i_ino; if (OVL_TYPE_MERGE(type)) stat->nlink = 1 ; return 0 ; }
我们观察到这里的stat先是拿了 err = vfs_getattr(&realpath, stat); 这个真实设备的 stat,后来又被替换为了overlayfs的超级块设备。
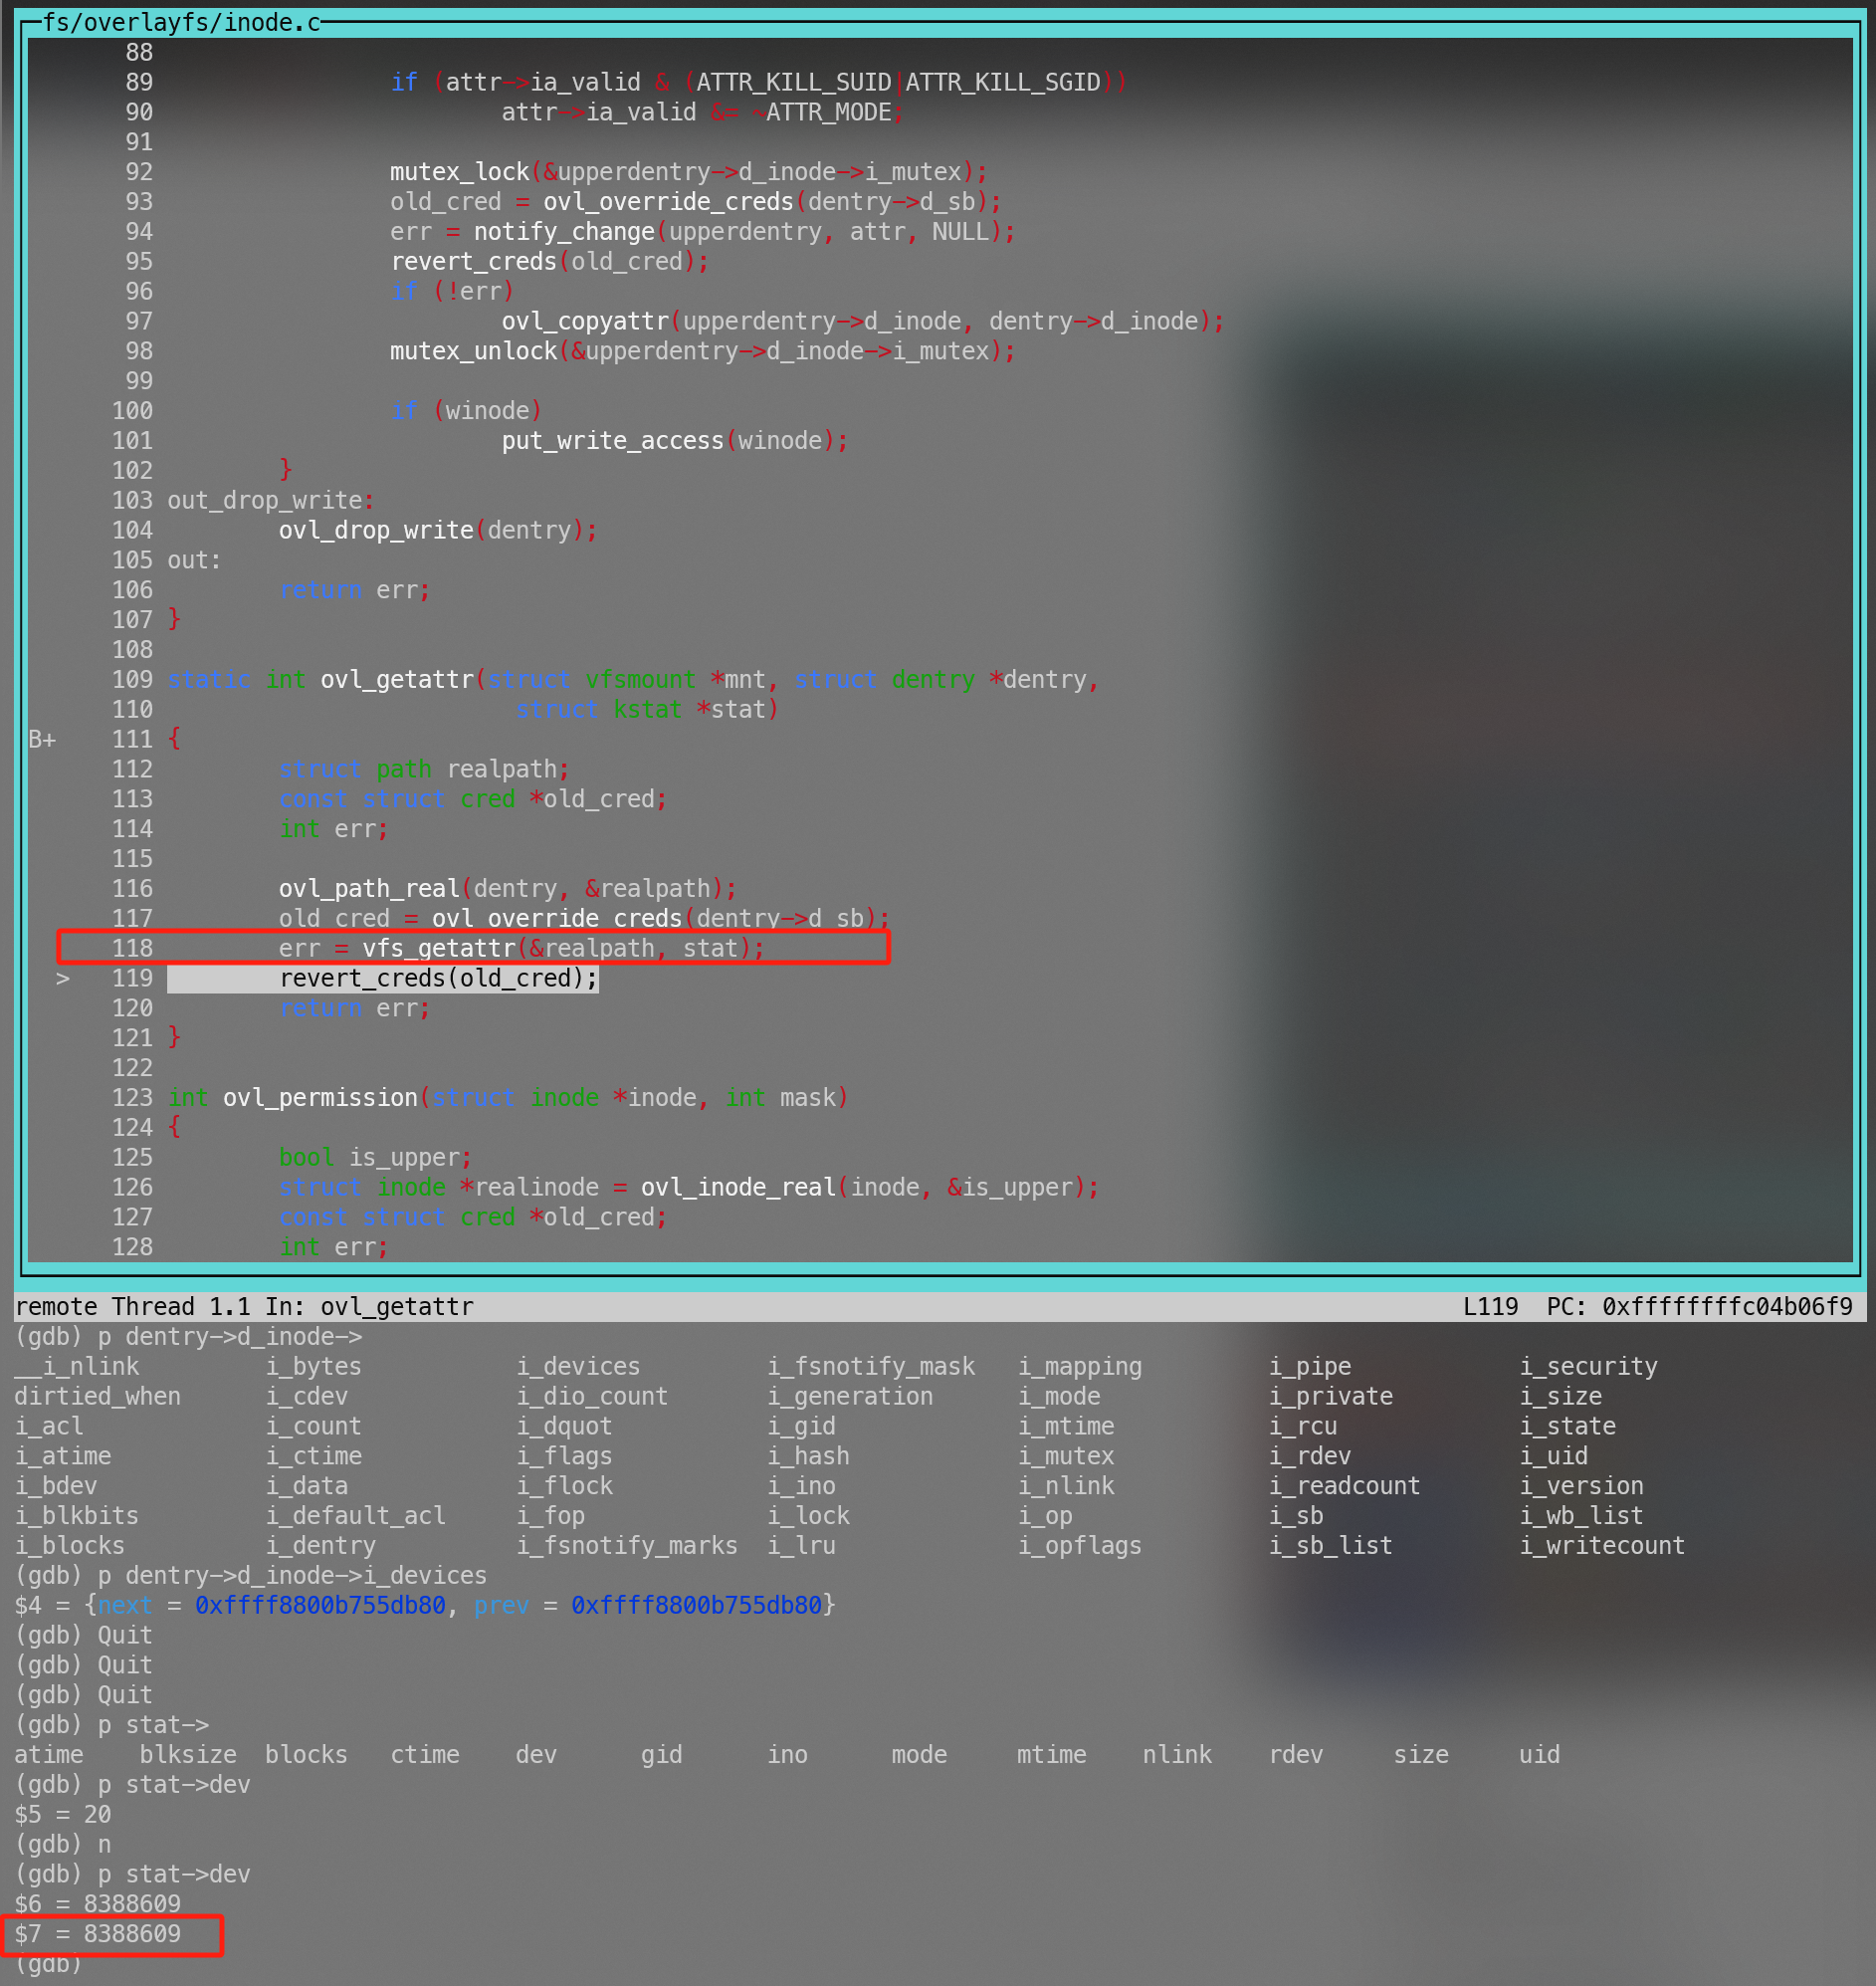
文件 1 2 3 4 5 6 7 8 9 10 11 12 13 static int ovl_getattr(struct vfsmount *mnt, struct dentry *dentry, struct kstat *stat ) { struct path realpath ; const struct cred *old_cred; int err; ovl_path_real(dentry, &realpath ); old_cred = ovl_override_creds(dentry->d_sb); err = vfs_getattr(&realpath , stat ); revert_creds(old_cred); return err; }
我们看到 err = vfs_getattr(&realpath, stat); 拿到之后直接返回了。因为这个原因导致的差别。
note
上边的排查过程其实是我知道结论之后,然后又找到一些工具之后归纳的一个理想的过程,我们下次的排查可能就会跟上文一样轻松。但是我第一次排查时,并且知道的工具很有限,所以是一路摸着坑过河。如果你对坑感兴趣可以继续阅读后续的部分。
真实问题排查(踩坑)过程 复现 vagrant 复现(失败) vagrant + virtualbox
1 2 vagrant init centos/7 --box-version 1804.02 vagrant up
本地的CPU是AMD的7840hs 这个版本启动时会报kernel panic 大体上踩到了virtualbox的坑具体可以参考: Unable to install CentOS 9 Stream
Qemu 复现 centos 7.4 对应的 1703 这个版本。这里安装有两种方式,一种是使用iso安装,一种是直接采用cloudimage+cloud-init的方式直接启动。这里选择了cloudimage的方式。之所以选择使用cloudimage的方式是因为不像是使用iso的方式需要自己从头走一遍安装流程,所有需要的东西可以通过cloud-init直接注入初始化。但实际上cloud-init是我踩的另一个坑。
下载并解压镜像
1 2 wget https: xz -d CentOS-7 -x86_64-GenericCloud-1708. qcow2.xz -k
cloud-init的使用方式可以有两种:
一个是直接起一个HTTP服务,然后把meta信息暴露出去,虚拟机直接获取。可以参考: IMDS
另一种方式是制作cloud-init iso镜像,具体可以参考如下两个文档
之所以研究了多个文档,以及很多论坛是因为踩到了另外的坑。因为本地使用的是Arch 没有文中提到 genisoimage 这个工具,而采用了 在本地虚拟机使用Alibaba Cloud Linux镜像
1 2 3 4 5 6 7 8 #meta-data instance-id: centos-debug local-hostname: centos-debug #cloud-config password: centos chpasswd: {expire: False} ssh_pwauth: True
执行如下命令:
1 docker run --rm -it -v $PWD :/cloud building5/genisoimage:latest -output /cloud/ciiso.iso -volid cidata -joliet -rock /cloud/user-data /cloud/meta-data
产生的iso可以用做cloud-init初始化使用。
启动系统:
1 qemu-system-x86_64 -net nic -net user,hostfwd=tcp::61234-:1234,hostfwd=::60022-:22 -m 4096 -nographic -hda CentOS-7-x86_64-GenericCloud-1708.qcow2 -cdrom ./ciiso.iso -smp 4 -s
用户:centos 密码:centos
安装基本软件
1 yum install wget strace perf gdb-gdbserver
尝试复现
1 2 3 4 5 6 7 8 9 10 11 12 13 14 15 16 cd /rootmkdir lo up work mergedmount -t overlay overlay -o lowerdir=./lo,upperdir=./up,workdir=./work ./merged mkdir merged/testtouch merged/test/1stat merged/test File: ‘merged/test’ Size: 15 Blocks: 0 IO Block: 4096 directory Device: 27h/39d Inode: 16993 Links: 2 stat merged/test/1 File: ‘merged/test/1’ Size: 0 Blocks: 0 IO Block: 4096 regular empty file Device: 801h/2049d Inode: 4207289 Links: 1
我们可以观察到 test 与 test/1 的device 不相同。问题得到很好的复现。
排查 strace 1 2 3 4 5 6 strace -P merged/test/1 stat merged/test/1 strace: Requested path 'merged/test/1' resolved into '/root/merged/test/1' lstat("merged/test/1" , {st_mode=S_IFREG|0644, st_size=0, ...}) = 0 File: ‘merged/test/1’ Size: 0 Blocks: 0 IO Block: 4096 regular empty file Device: 801h/2049d Inode: 4207289 Links: 1
在这里我们知道大体上是通过lstat这个系统调用获取到的信息。我们进一步想知道到底是哪个内核函数。
perf(失败) 我本以为这个步骤会非常顺利,但是实际上没有走下去。
1 2 3 4 5 6 7 8 9 10 11 12 13 14 15 16 17 18 19 20 perf record -ag--call-graph dwarf -F max stat merged/test/1 失败,获取不到lstat相关的调用,也米有overlay类似字样的函数。 stat 1301 [002] 2217.236458: 250000 cpu-clock: ffffffff812c3005 avtab_search_node+0x55 ([kernel.kallsyms]) ffffffff812ca339 context_struct_compute_av+0x1a9 ([kernel.kallsyms]) ffffffff812cae19 security_compute_av+0xf9 ([kernel.kallsyms]) ffffffff816a3000 avc_compute_av+0x34 ([kernel.kallsyms]) ffffffff812b46c8 avc_has_perm_flags+0xd8 ([kernel.kallsyms]) ffffffff812b5573 selinux_sb_statfs+0x63 ([kernel.kallsyms]) ffffffff812b1ae6 security_sb_statfs+0x16 ([kernel.kallsyms]) ffffffff81234751 statfs_by_dentry+0x71 ([kernel.kallsyms]) ffffffff8123483b vfs_statfs+0x1b ([kernel.kallsyms]) ffffffff81234925 user_statfs+0x55 ([kernel.kallsyms]) ffffffff81234997 SYSC_statfs+0x27 ([kernel.kallsyms]) ffffffff81234b9e sys_statfs+0xe ([kernel.kallsyms]) ffffffff816b4fc9 system_call_fastpath+0x16 ([kernel.kallsyms]) 7fd058179657 __statfs+0x7 (/usr/lib64/libc-2.17.so) 0 [unknown] ([unknown]) 大体上找到最相关的内容就只有这部分,但是依然很难定位到具体是哪个方法。
本来的思路是想通过 strace 找到对应的系统调用,然后利用perf进一步跟踪内核函数,定位到跟overlayfs相关的一些调用,然后去分析代码。这是一个相对容易定位的一个过程。而且对个人依赖能力较小。
note
猜测还是因为采样频率不太够会丢掉很多事件,大佬们如果知道也可以评论一下 。
Kprob & functrace(失败) 略,具体也是拿不到相关的函数不知道为什么,期望知道的大佬们补充。最离谱的是到这里我perf-tools里面的工具看了很多,都没有注意到 funcgraph 这个工具如果注意到可能就没有后边踩坑的经历了。
内核调试 既然perf抓不到,那就只能跟踪代码,直到开始排查之前我才意识到,我并不太清楚一个lstat到底对应哪个内核函数。
第一次内核调试 通过man 2 lstat 能够拿到如下结果
1 2 3 4 5 6 7 8 9 10 11 12 13 14 15 16 C library/kernel differences Over time, increases in the size of the stat structure have led to three successive versions of stat (): sys_stat() (slot __NR_oldstat), sys_newstat() (slot __NR_stat), and sys_stat64() (slot __NR_stat64) on 32-bit platforms such as i386. The first two versions were already present in Linux 1.0 (albeit with different names); the last was added in Linux 2.4. Sim‐ ilar remarks apply for fstat() and lstat(). The kernel-internal versions of the stat structure dealt with by the different versions are, respectively: .... 省略若干 The glibc stat () wrapper function hides these details from applications, invoking the most recent version of the system call provided by the kernel, and repacking the returned information if required for old binaries. On modern 64-bit systems, life is simpler: there is a single stat () system call and the kernel deals with a stat structure that contains fields of a sufficient size. The underlying system call employed by the glibc fstatat() wrapper function is actually called fstatat64() or, on some ar‐ chitectures, newfstatat().
也尝试在这些函数上打了断点,但是都没有结果。最后无奈只能转向Glibc,去研究下Glibc是怎么调用系统内核函数的。
寻找内核函数 这里也遇到一个坑就是,gdb的时候流程会乱跳,原因是,开启了编译优化。所以很多函数跟循环就会被优化掉,也可能内联掉,当然也可能会被改写。所以思路就是重新编译glibc,然后关闭优化。最后发现实际上是不可行的Glibc禁止关闭优化。具体参考:glibc FAQ
1 2 3 4 5 6 yum install gdb gdb-gdbserver nss-softokn-debuginfo –nogpgcheck debuginfo-install glibc coreutils gdb stat gdb)b main gdb) run /home/centos/merged/test/ gdb) 你就一路往下跟吧 s 一路跟,发现不对就f
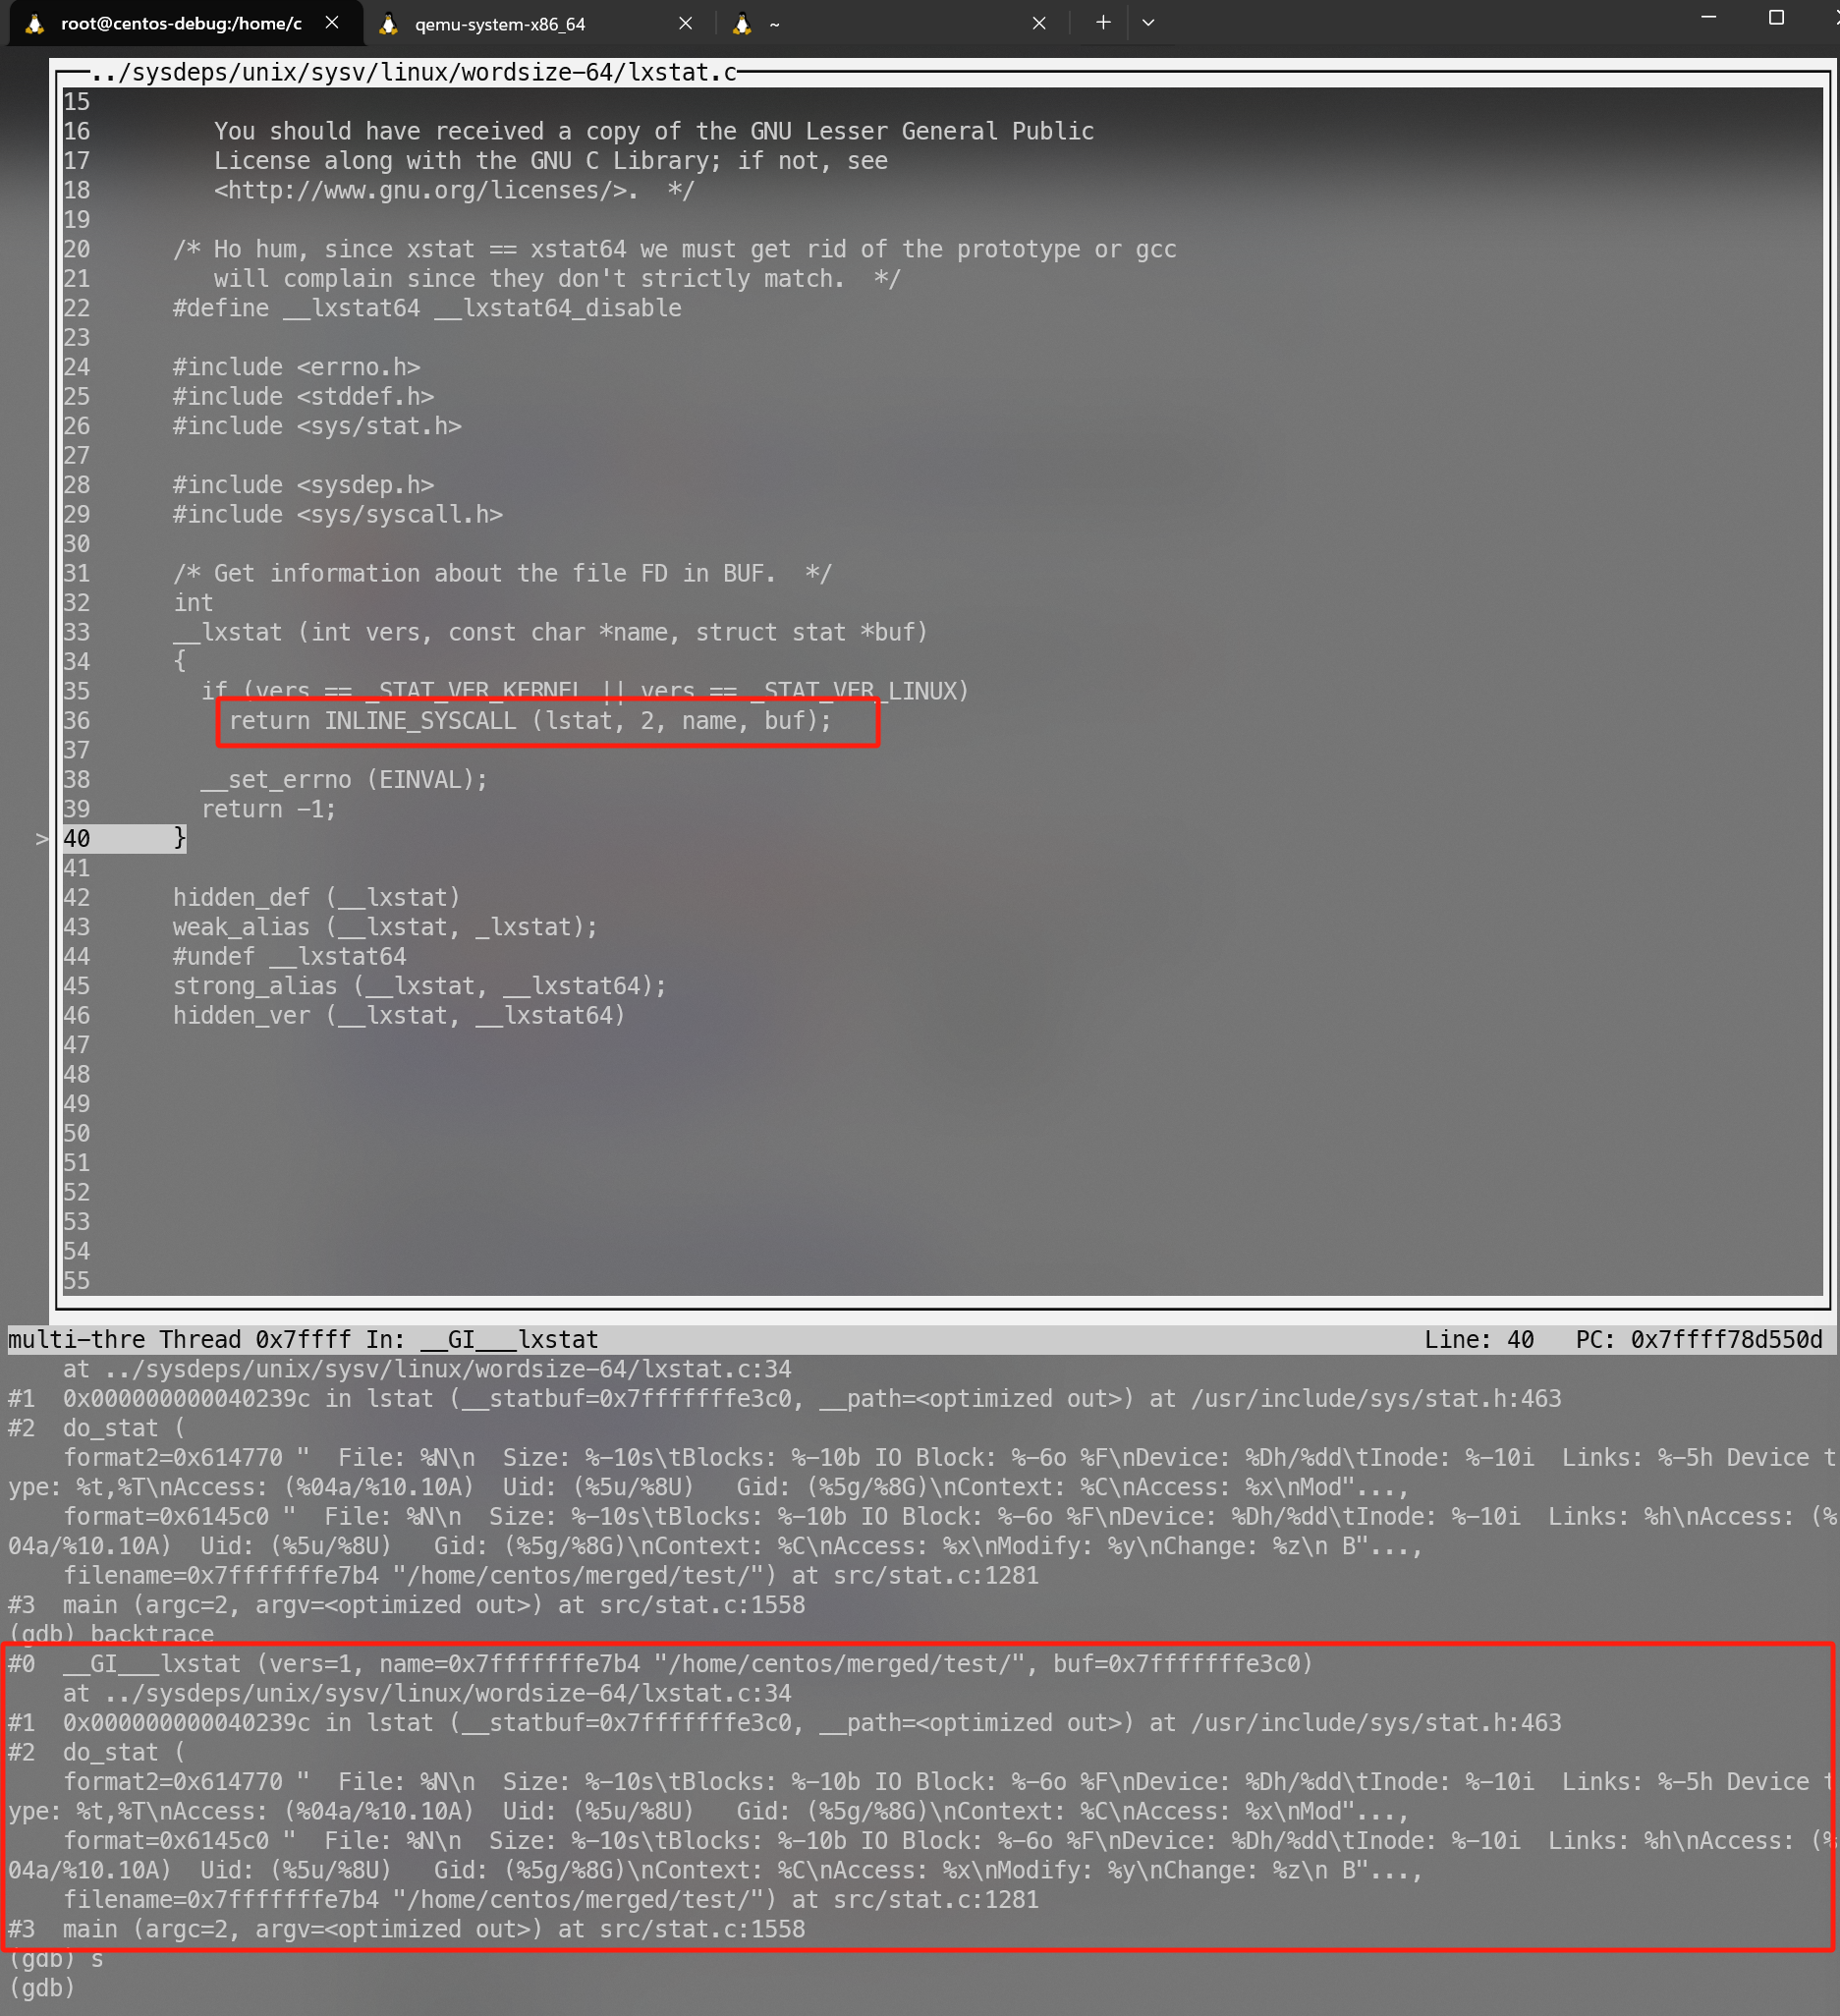
到代码中红线的位置中就没办法跟了,检索了glibc的相关代码,太多了。直接进行一波学习具体参考: 瞧一瞧Linux:如何实现系统API?
我们是可能跟文章里的稍有不同,但是大体上的逻辑是一致的。通过 INLINE_SYSCALL(name, nr, args…) → INTERNAL_SYSCALL(name, err, nr, args…) → define INTERNAL_SYSCALL(name, err, nr, args…) → INTERNAL_SYSCALL_NCS(name, err, nr, args…) 具体代码如下:
1 2 3 4 5 6 7 8 9 10 11 12 13 14 15 16 17 18 19 20 21 22 23 24 25 ({ \ unsigned long int resultvar = INTERNAL_SYSCALL (name, , nr, args); \ if (__builtin_expect (INTERNAL_SYSCALL_ERROR_P (resultvar, ), 0)) \ { \ __set_errno (INTERNAL_SYSCALL_ERRNO (resultvar, )); \ resultvar = (unsigned long int) -1; \ } \ (long int) resultvar; }) // 注意这里这里做了一个替换 __NR_ // 在这个文件中 /usr/include/asm/unistd.h INTERNAL_SYSCALL_NCS (__NR_ ({ \ unsigned long int resultvar; \ LOAD_ARGS_ LOAD_REGS_ asm volatile ( \ "syscall\n\t" \ : "=a" (resultvar) \ : "0" (name) ASM_ARGS_ (long int) resultvar; })
我们根据源码的提示我们去 /usr/include/asm/unistd.h 里面查看对应的sys call 的序号。里面告诉我们要去 /usr/include/asm/unistd_64.h 找。
1 2 cat /usr/include/asm/unistd_64.h |grep __NR_lstat
有了这个我们再去内核去找。当前我们知道是调用了 __NR_lstat 然后 分配的是6号。
内核代码如下:
1 2 3 4 5 6 7 8 9 10 11 12 13 14 15 16 // arch /x86/syscalls/syscall_64.tbl 0 common read sys_read 1 common write sys_write 2 common open sys_open 3 common close sys_close 4 common stat sys_newstat 5 common fstat sys_newfstat 6 common lstat sys_newlstat
内容大致如上。我们推测大体上应该是 6 号这个调用会对应到内核中的sys_newlstat函数。
但是内核中会有一系列复杂的宏转换如下所示。
1 2 3 4 5 6 7 8 9 10 11 12 13 14 15 16 17 18 19 20 21 22 23 24 25 // include/linux/syscalls.h // 注意这里的 _ // 略过 SYSCALL_METADATA(sname, x, __VA_ARGS__) \ __SYSCALL_DEFINEx(x, sname, __VA_ARGS__) // 这里开始生成具体的函数了 // 大体会有 // asmlinkage long sys_newlstat // static inline long SYSC_newlstat // asmlinkage long SyS_newlstat asmlinkage long sys static inline long SYSC asmlinkage long SyS { \ long ret = SYSC __MAP(x,__SC_TEST,__VA_ARGS__); \ __PROTECT(x, ret,__MAP(x,__SC_ARGS,__VA_ARGS__)); \ return ret; \ } \ SYSCALL_ALIAS(sys static inline long SYSC
所以实际上我们直接搜索 sys_newlstat 是没办法搜索到的。
大体上是:
SYSCALL_DEFINE{参数个数}(函数名,xx,xx) → sys_{函数名}
SYSCALL_DEFINE{参数个数}(函数名,xx,xx) → SYSC_{函数名}
至于为什么这么复杂,在网上看到一些分析说是一个CVE造成的,对我来说有写复杂看了半天没看懂就略过了更多参考:
1 2 3 4 5 6 7 8 9 10 11 12 13 // fs/stat.c SYSCALL_DEFINE2(newlstat, const char __user *, filename, struct stat __user *, statbuf) { struct kstat stat ; int error; error = vfs_lstat(filename, &stat ); if (error) return error; return cp_new_stat(&stat , statbuf); }
基于上面我们得出一些基本结论,直接跟踪 sys_newlstat 就可以了。
内核调试 在这一步我卡了非常长的时间,主要集中如下几个问题。
一个是qemu指定了kernel的话会panic。最后决定不指定kernel 参数。直接在系统内安装需要调试的内核。
另一个是kernel调试的过程中,也于Glibc一直,不少函数的流程会跳来跳去,主要也是由于编译优化的问题。编译的工程中发现kernel也不能够O0编译。有一些hack手段跟特殊平台比如arm是支持的,就没搞。
可能存在一些快速路径或者什么有的时候断点进不去。(待确认)
最主要的一个问题就是ko的符号表导入的有问题。
文中 提到的 lx-symbols这个命令我没有(3.10 版本没有相关的脚本),但是实际上内核主流程调试都正常。但是没执行这个ko的符号表都导入不进来,使得我调试的过程中一直在怀疑人生。尝试使用add-symbol-file overlay.ko.debug
Debugging your Linux Kernel Module
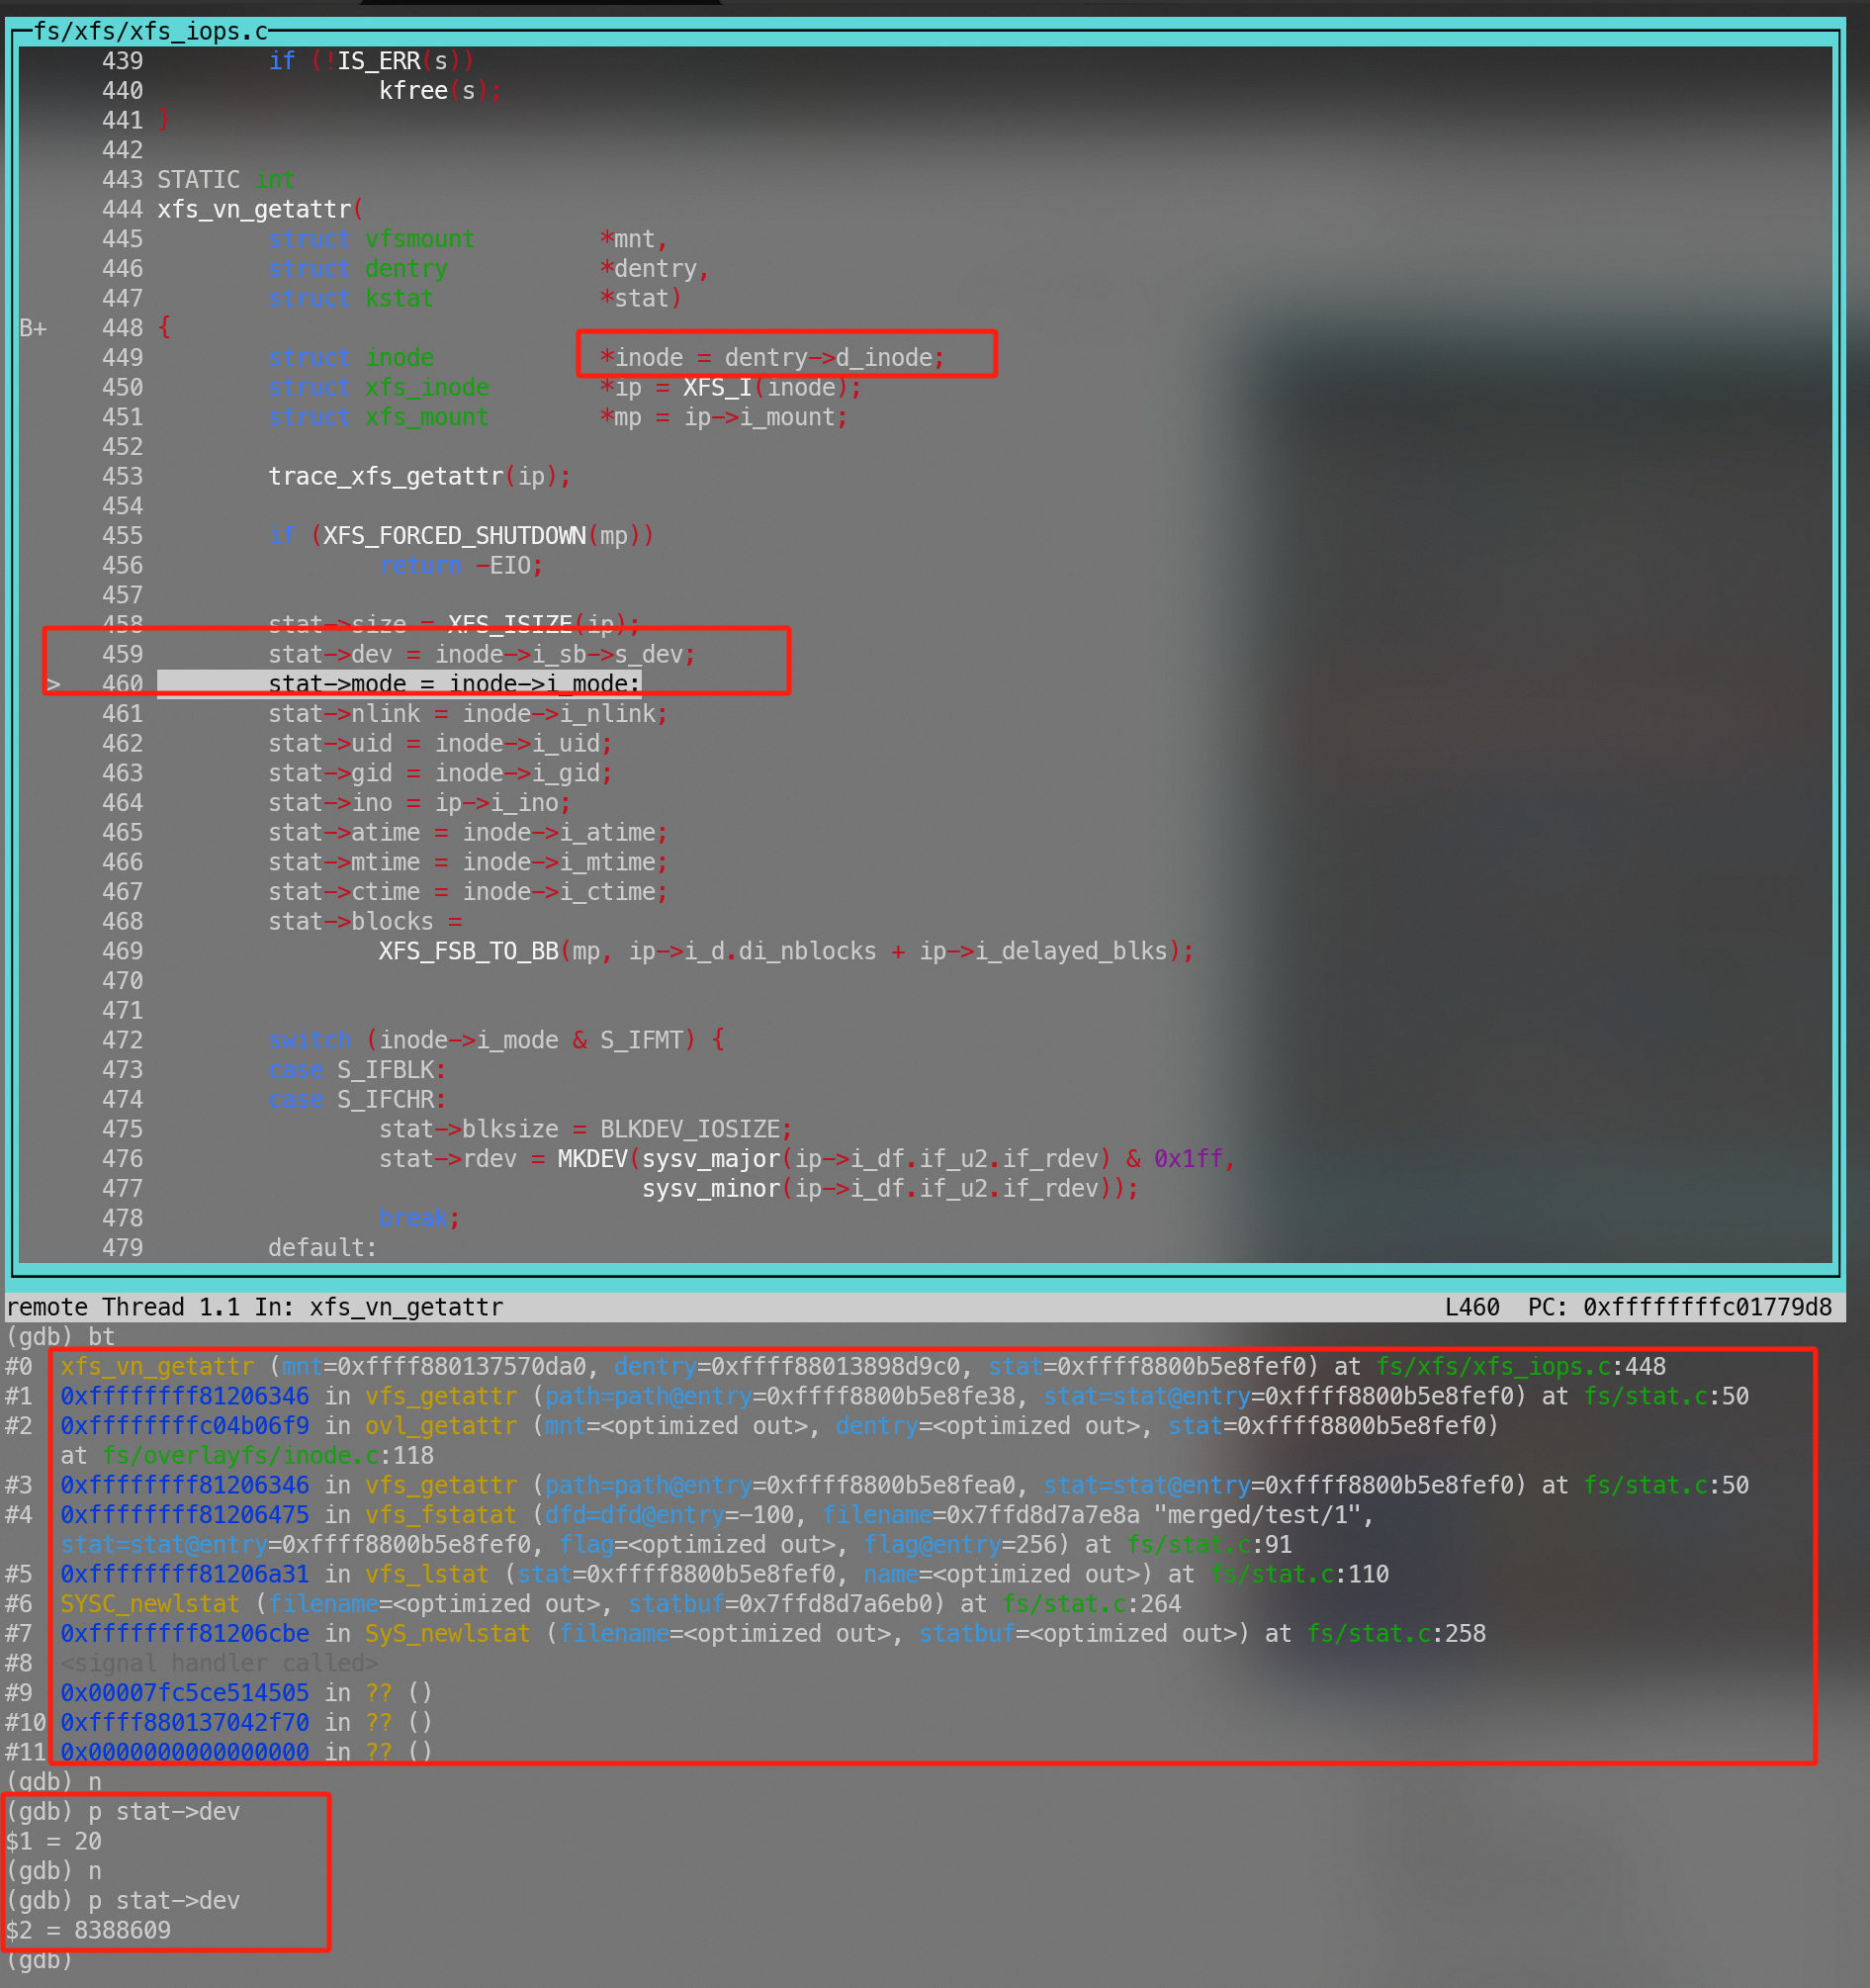
1 2 3 4 5 6 7 8 9 10 11 12 13 14 15 //被调试机器执行 cat /sys/module/overlay/sections/.text0xffffffffc04ae000 cat /sys/module/xfs/sections/.text0xffffffffc011d000 //调试机器执行 gdb vmlinux (gdb) dir linux-3.10.0-693.el7/ (gdb) add-symbol-file overlay.ko.debug 0xffffffffc04ae000 (gdb) add-symbol-file xfs.ko.debug 0xffffffffc011d000 // 连接到qemu进行调试,我们启动qemu的时候指定的-s 参数默认不指定端口是1234 (gdb) target remote :1234 (gdb) b sys_newlstat (gdb) c
目录最后拿的是overlayfs超级块的s_dev
文件跟目录走了不同的方法,文件最终还是去拿了背后真实的设备的id。
总结 实际上兜兜转转踩了很多坑。避开所有坑的情况下大致总结为如下流程。
确认系统调用
确认内核函数入口
trace内核函数调用 这个通过搜索最后发现了一个 funcgraph 非常好用。相见恨晚,但是前提是知道内核的入口函数是什么,当然现在我们已经知道了也知道如何简单获取了。
在可疑函数下断点
感想
各种大模型还挺好用,特别是能够提供可靠输入的情况下。
如果最开始有看文档的意识其实很多东西就直接解决了。不管是overlayfs本身的文档还是各种工具,man 的文档其实比很多文章靠谱太多了。
参考 https://flyflypeng.tech/云原生/2023/03/29/Overlay-文件系统.html
https://litux.nl/mirror/kerneldevelopment/0672327201/ch12lev1sec7.html
https://forums.virtualbox.org/viewtopic.php?p=546572&hilit=Kernel+panic#p546572
https://cloudinit.readthedocs.io/en/latest/tutorial/qemu.html#start-an-ad-hoc-imds-webserver
https://access.redhat.com/documentation/en-us/red_hat_enterprise_linux/8/html/configuring_and_managing_cloud-init_for_rhel_8/configuring-cloud-init_cloud-content
https://www.alibabacloud.com/help/zh/alinux/getting-started/use-alibaba-cloud-linux-3-images-in-an-on-premises-environment
https://www.brendangregg.com/perf.html
https://github.com/zerovm/glibc/blob/master/FAQ#L596-L619
https://time.geekbang.org/column/article/407343
https://gityuan.com/2016/05/21/syscall/
https://blog.csdn.net/rikeyone/article/details/91047118
https://hazirguo.github.io/articles/2013/syscall_marco_define.html
https://medium.com/@navaneethrvce/debugging-your-linux-kernel-module-21bf8a8728ba
https://www.kernel.org/doc/html/v4.14/dev-tools/gdb-kernel-debugging.html